English
 Deutsch
 Italiano
 Français
 Español
Accelerator Decelerator Indicator in Forex Trading
We continue our large-scale series of articles about Forex indicators. In this article we will look at Accelerator Decelerator — an indicator that measures acceleration and deceleration of the current driving force. It may sound complicated for now, but now we will look at this in great detail, with examples and screenshots.
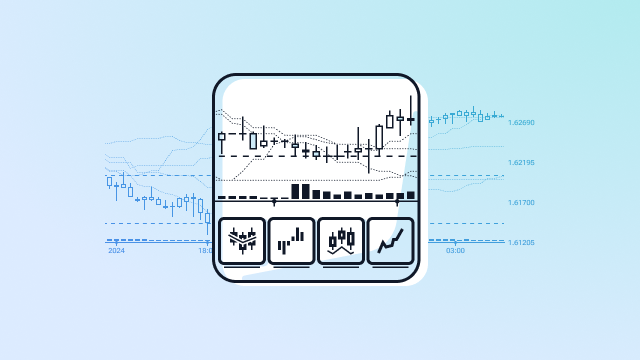
INDICATOR: ACCELERATOR DECELERATOR
Accelerator Decelerator: how to control the player’s pressure at the market effectively.
The Acceleration Deceleration indicator is a logical continuation of the Awesome Oscillator of Bill Williams (AO) and implements the idea that before the change of the direction the price changes in the last turn.
Before a turn, the price gradually reduces the dynamics on the current trend, as a result, the trader needs to estimate its acceleration («+» or «-»), which at the time of the actual turn has to be equal to zero.
Right now, you can join the Beta testing program to get access and help to improve FTO.
Join FTO Beta testing Waitlist to get access soon
Logic and purpose
Accelerator Decelerator (AC) advances the actual dynamics:
Before a turn, the AC histogram is developed (is slowed down) first as the price stops updating the extreme values, before strengthening of a trend the histogram begins to grow.
The central line of the indicator – the level at which acceleration of the price is balanced with the driving force of the market.
According to the author’s strategy of Profitunity:
If the AC histogram is higher than the zero line (positive) and:
- grows – the bull trend amplifies (buyers stronger, it is easier for the price to go up);
- decreases – the bull trend weakens, the turn or the flat is possible;
if the AC histogram is lower than the zero line (negative) and:
- falls – the bear trend «accelerates» (sellers prevail, it is simpler to price to decrease);
- raises – the descending direction weakens, we wait for a turn or flat.
Calculation procedure
The standard Accelerator Decelerator indicator uses a concept of the average (median price) price of the current bar:
(High+Low)/2
In some sources for calculation the closing price is included in the calculation of an average:
(High+Low+Close)/3
It is supposed that such price moves more smoothly than the average, but, nevertheless, reflects similar dynamics. The concept of the median price is used much more often.
After determination of the base settlement price (median or typical), the exponential sliding average with the period 5 is calculated − EMA(5), or «fast» average, and similar «slow» average EMA(34). The difference between values of these MA gives data for creation of the Awesome Oscillator indicator.
Further, to enhance its advancing properties, it is necessary to calculate a difference between the value of the AO indicator’s histogram and its moving average of SMA(5) – only then we obtain necessary data for Accelerator Decelerator.
The calculation in the form of formulas:
MedianPrice=(High+Low)/2, (for TypicalPrice = (High+Low+Close)/3);
AO=SMA (MedianPrice; 5) −SMA (MedianPrice; 34),
AC=AO−SMA(AO; 5).
Parameters and control
This technical indicator of oscillator type is a part of all popular trading platforms and is displayed as the color histogram in an additional window. There are non-standard options for the AC placing the histogram directly on the price schedule.
Most often traditional red-green scale is applied to the histogram, but the trader can independently choose a color scheme. The zero line is displaced in dynamics depending on what trend prevails in the market.
Williams recommends to use parameters of the indicator 5 and 34, but here’s the problem:
This system was developed more than 20 years ago and for the futures and stock market with stable volatility.
So modern traders are recommended to select parameters individually under certain assets, time frames, the periods of activity and other trade conditions, otherwise it is necessary to fight against the mass of false signals.

The first parameter of the indicator isn’t recommended to change as it reflects the wave structure of the calculation and «is tied» to standard Elliot`s wave model (5 main and 2 auxiliary waves) and also to the model of a Mandelbrot’s fractal.
The second parameter and the type of calculation of average are corrected usually, for example, in practice the parameters (5; 20; 3; EMA) are chosen for actively volatile tools.
Read also:
Best FXReplay alternatives in 2024
TradingView Alternatives in 2024: Best Paid & Free Competitor
Trade signals of the indicator
For making a decision on the direction of an entry in the market it is necessary to track the change of color of the histogram:
- if the current bar is red – we do not buy, we open only sell or we do not trade at all;
- if the current bar is green – we do not sell, only purchases are possible or we are out of the market.
If we open the transaction in the direction of the driving force’s strengthening, that is on the positive histogram – for purchase, on the negative – for sell, then there are enough two bars of the appropriate color.
For a long position: 1 red and 2 green serial bars with a higher max shall be created on the positive AC histogram. We put the BuyStop order by 1-3 points higher than a maximum of a signal bar.

For a short position: the signal arises on normal logic – the direction changes from top to down − 1 green and 2 red bars with lower min appears sequentially on the negative histogram. We put the SellStop order by 1-3 points below than a minimum of a signal candle.

To make the decision on the transaction against the direction of an acceleration − purchase on the histogram is below zero or sell on the histogram above the line of balance – needs an additional bar as confirmation.
For a long position: 1 red and 3 green serial bars with higher min shall be on the negative histogram. We put the BuyStop order by 1-3 points higher than a maximum of a signal candle.

At the same time if one of the first 2 green bars punches the zero line, then it is already possible to buy on the third bar.
For a short position: the appearance of 1 green and two red bars which sequentially decrease on the positive histogram is necessary. SellStop is placed by 1-3 points lower than a low price of a signal bar.

If one of first two bars cross the zero line, then it is possible to open the transaction for sale already on the last red bar.
The intersection of the zero line by the Accelerator Decelerator histogram is not a trade signal!
The fact of the balance line breakthrough influences only necessary number of bars, depending on the position of the histogram of the indicator in relation to the zero line.

On the AC indicator, a divergence signal, traditional for oscillators, with the price (the price forms a new extremum, and the schedule of the indicator moves in the opposite direction) appears much less often.
It means that the current direction of a trend weakens (is slowed down), that is − at such situation will be logical to open the transaction towards the breakthrough of zero level. In that case, we put StopLoss behind the next local extremum
Several practical remarks
If the Accelerator Decelerator indicator shows a standard trade signal, but before execution of the postponed orders (exposed according to rules!), the histogram changes color − the signal is considered incorrect and is canceled.
It is possible to leave trade orders in action if they are rather far from a point of a turn of the histogram and the general direction of a trend remains relevant.
It is possible to apply AC as the indicator of flat markets − during the periods of low volatility its histogram fluctuates in a zone of the zero line with the minimum amplitude.
The indicator is effective in combination with trend tools, for example, the Moving Averages or Bollinger Bands, and, naturally, it can be combined with other tools of Williams (see the Chaos theory).
We have highlighted additionally the trading strategy based on Awesome Oscillator and the Accelerator Decelerator, check here how these two tools can be combined effectively.
In a set of Accelerator Decelerator, the first generates a trade signal, but it is not recommended to use it as the independent tool, only as the complementary filter.
If to apply the AC histogram with fractals, then it is necessary to consider that its signals have only the confirming character, and the contact of the first fractal will be the main signal − only after that orders can be exposed according to AC indicator signals.
Here’s how it goes:

Rather difficult mathematics of the Accelerator Decelerator indicator allows smoothing speculative throws of the price, for example, on news, that allows using it on any assets even in the unstable market. Its signals can be considered reliable only for medium-term transactions on the time frames from H1 above.
 Sign Up to FTO Waitlist