Awesome Oscillator: how the price movements can be read easily with one tool only
Time has come to introduce you the Awesome Oscillator indicator. It was invented by Bill Williams who decided to use the median prices instead of using the closing prices like in MACD indicator.
According to Williams, Awesome Oscillator, evaluating dynamics of the price movement — the most effective element in his trade system Profitunity.
Even if you not the fanatic of the wave market theory, it will be very useful to see accurately wave pieces in the market to enter the market after the termination of an old wave in an optimum point of the new.
Using the Awesome Oscillator, it is possible to make the analysis of the several time intervals before the moment of a possible turn. The indicator has excellent visual completion and noncritical delay – the author considers that only on the wonderful AO oscillator it is possible to construct a full strategy.
So let’s begin.
What is Awesome Oscillator?
Awesome Oscillator was based on the MACD indicator, which is quite similar to this indicator. Awesome oscillator indicator describes the spread between two Simple Moving Average’s that allows understanding the upcoming market direction.
The main point of the Awesome Oscillator is that it’s a signal line of the MACD indicator, but the difference is in the typical prices and different parameters (34 and 5).
The main difference between the Awesome Oscillator indicator and MACD indicator consists in that in MACD indicator, the close prices are applied and the awesome oscillator uses the median prices. Awesome oscillator – is very useful and flexible indicator of technical analysis that helps traders to estimate the market dynamic and potential points of trend turnings.
Logic and purpose
Bill Williams considers that the price is the final result of the influence of all market factors, and therefore changes in the last turn.
Before the price, the Momentum has to react – its speed, and change of trade volume act as the main reason for price dynamics.
The Awesome Oscillator indicator measures the Momentum of five last bars and this value compares to the Momentum of the last 34 bars, which is trying to analyze short-term market moods in long-term tendencies.
It gives the chance not only for an optimum first entrance, but also a possibility of further increase of a position on the developing trend.
Awesome Oscillator indicator: Calculation procedure
The Awesome Oscillator indicator calculates a difference of the prices of slow SMA (MedianPrice, 34) and fast SMA (MedianPrice, 5).
AO = SMA (Median Price,5) – SMA (Median Price, 34)
Median Price = (High + Low)/2, where:
- High – maximum price of the bar
- Low – minimum price of the bar
- SMA – simple moving average
This difference is considered the assessment of driving force of the market and is brought to the resultant histogram.
The indicator is similar to MACD, but its dynamics are considered more rounded due to use of the average price instead of the traditional price of the closing, and signals – earlier.
The histogram fluctuates near the zero line, but unlike MACD, has no signal line.
Awesome Oscillator indicator: Parameters and settings
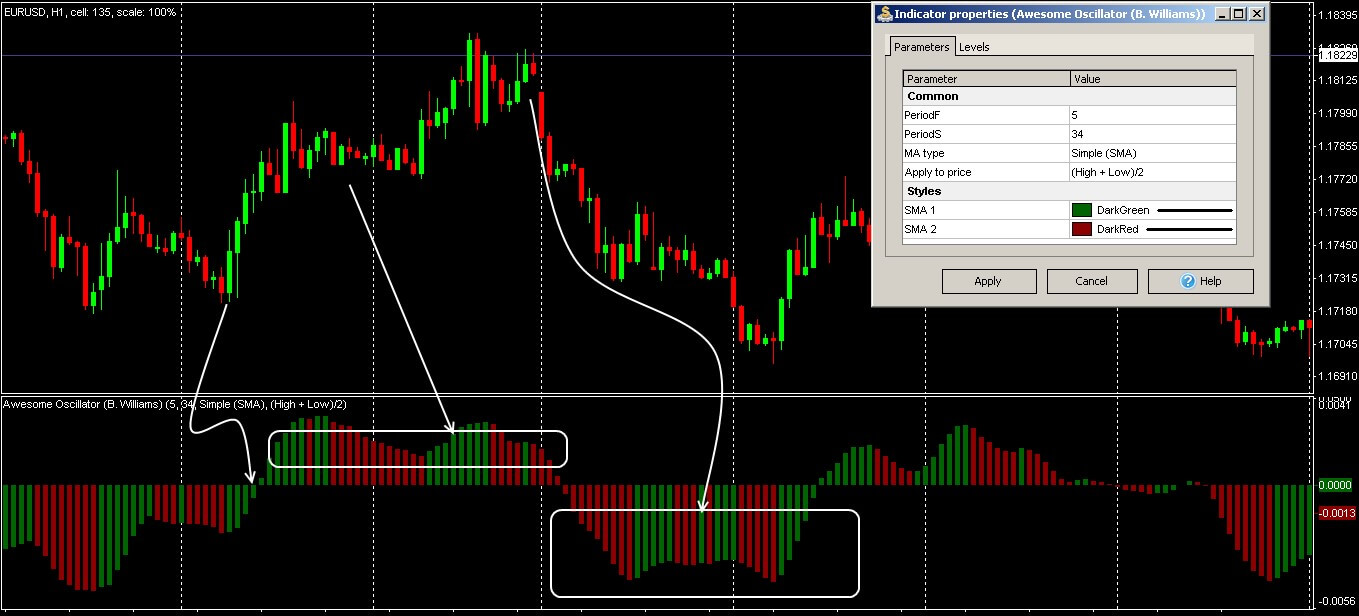
Awesome Oscillator is included in the standard package of all popular trading platforms, by default the histogram has the red-green color scale and is shown in an additional window, in parameters it is possible to change the thickness of columns and to add additional levels.
The green column of the histogram is formed if the current bar is higher than previous, red – if below.
Standard version of the indicator
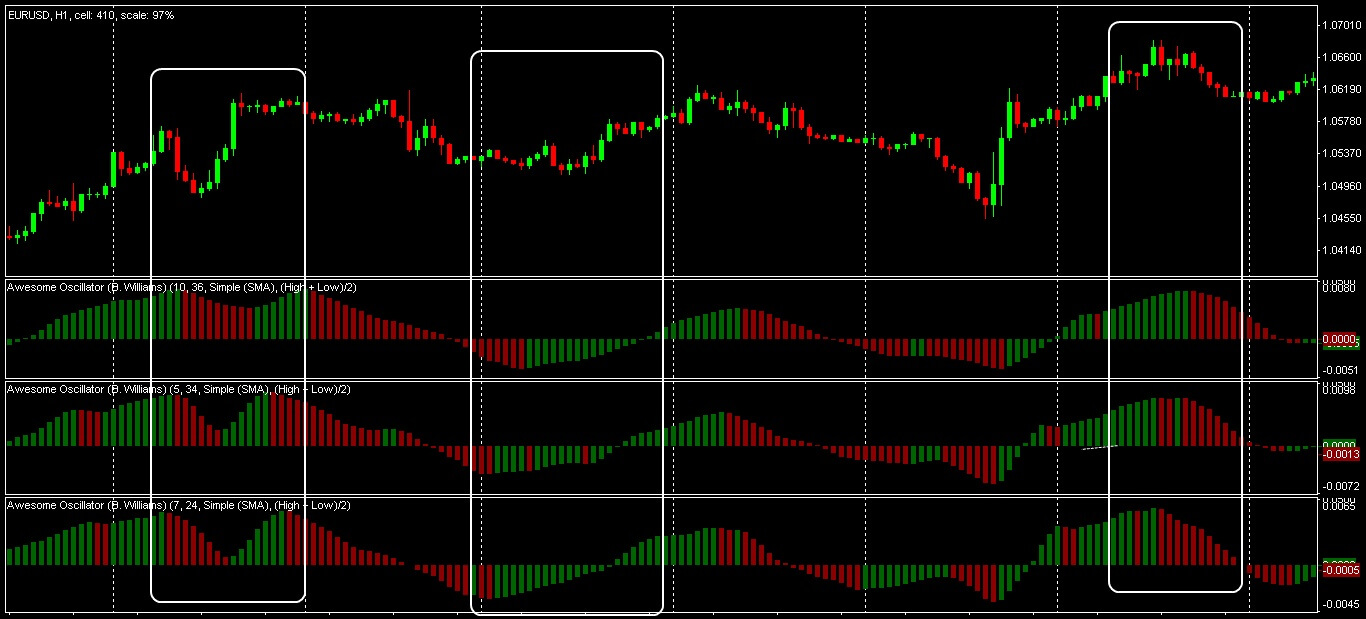
The basic periods of calculation of moving averages aren’t recommended to be changed (curious can try options − (7; 24), (10; 36)), but Williams claims that these parameters are optimum for the full analysis of the market. The visual presentation of results of calculation in the form of the histogram allows controlling not only the behavior of the indicator concerning the line of balance, but also to see in time divergence situations with the price.
Control of the Awesome Oscillator parameters
Trade Awesome Oscillator indicator signals
Completely created (closed) bar which color does not change anymore is considered a signal.
The color of the key bar for an entrance on a trend shall correspond to the direction of the transaction: purchase – green, sale — red.
Scheme of trade signals
The color of the key bar before a turn shall be opposite color, that is, for example, before a bull turn the indicator shall be red – the transaction can already be opened, but such input is considered riskier.
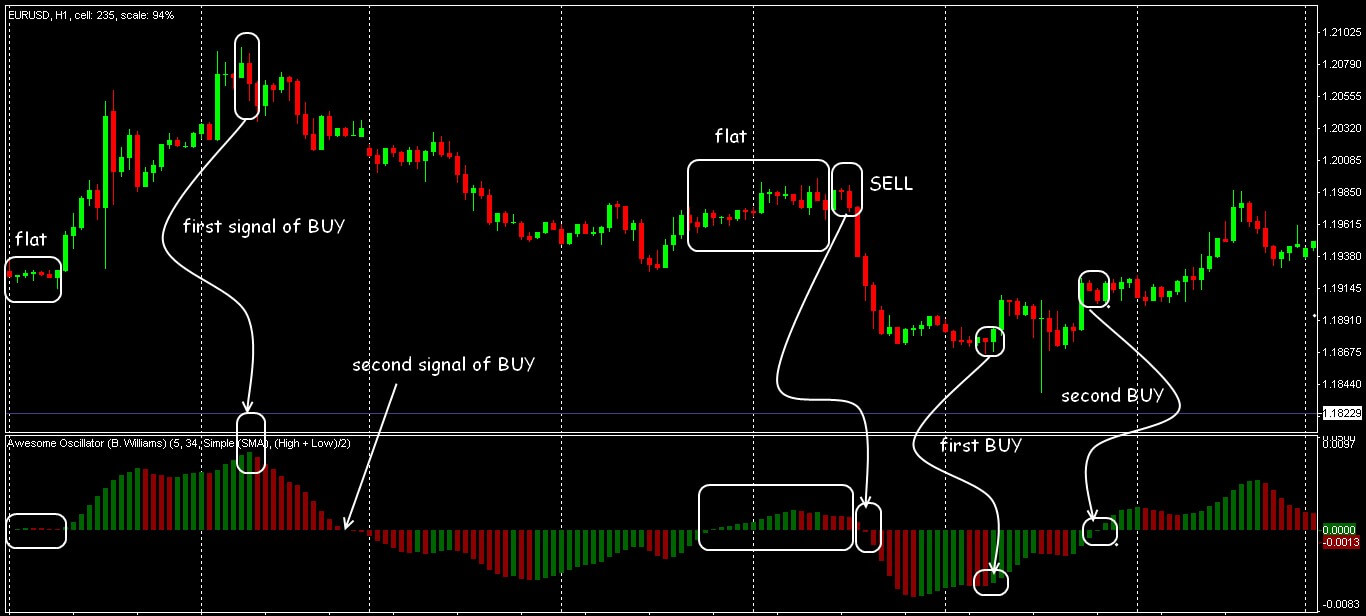
When the Momentum of the market changes, the indicator shall be colored in green color through 3-4 bars is and there will be a point for the second entrance in the new market.
As well as the normal oscillator, Awesome Oscillator allows estimating a condition of overbought / oversold. If the trade signal completely corresponds to conditions, but the color of the histogram changed –we do not take such signal in hand!
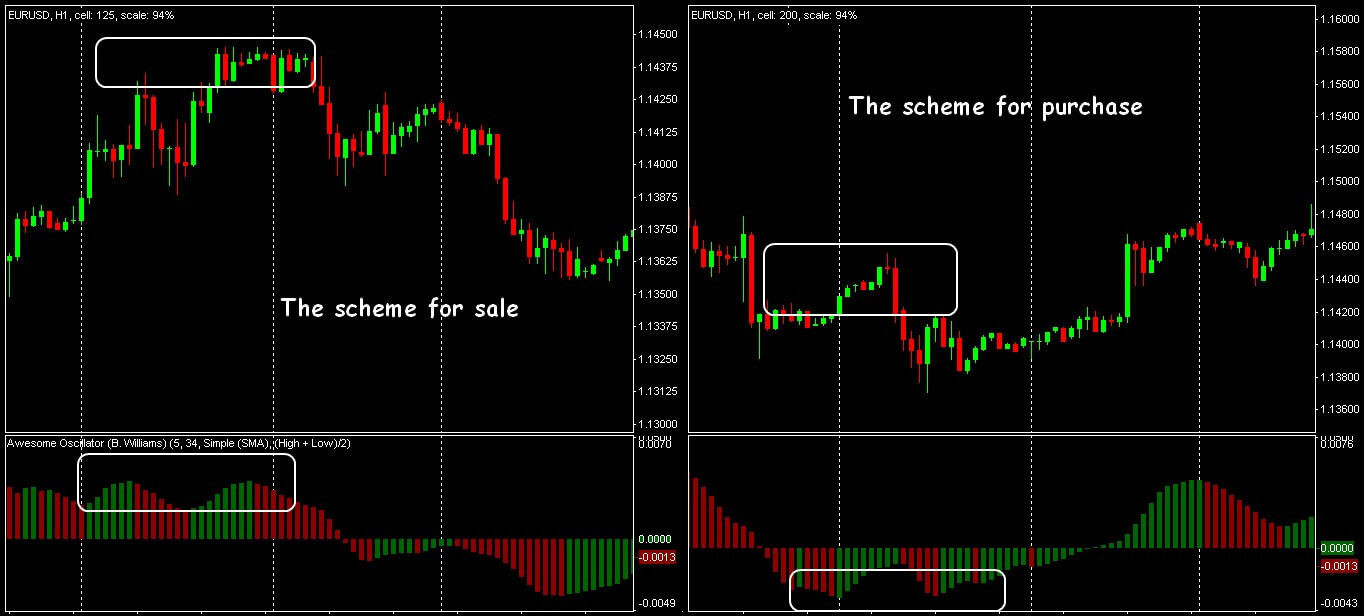
The indicator gives trade signals on several standard patterns.
1. «Saucer»
The model means the soft transformation of driving force of the market in the direction of growth or falling.
- For purchase: all columns of the histogram shall be above zero level. The signal arises when changing the direction of the indicator with ascending and is created by three (or several) columns according to the diagram below. Stop Loss is slightly higher than a maximum of the first bar in a pattern, signal bar – green.
A pattern «Saucer» on the histogram AO
- For sale: all columns of the histogram shall be below zero level. The signal arises when changing the direction of the indicator with descending and is created by three (or several) columns according to the diagram below. Stop Loss − is slightly higher than a minimum of the first bar in a pattern, signal bar – red.
2. «Breakthrough of zero level»
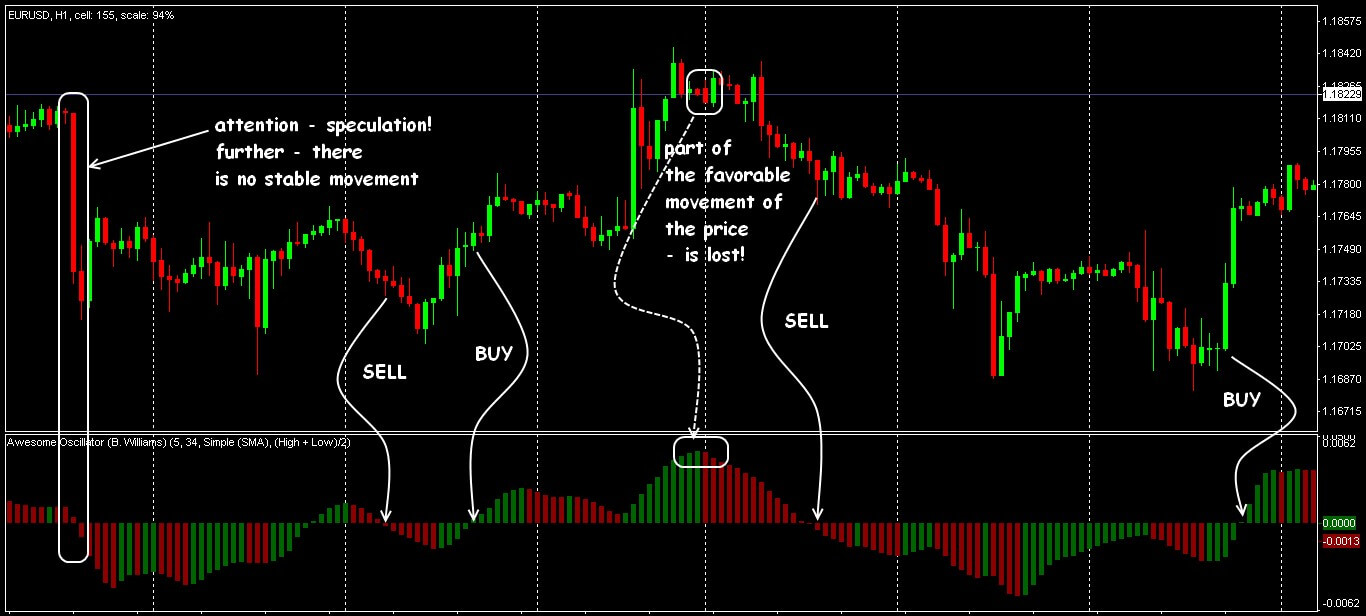
- For purchase: dynamics of the histogram changes from the negative to the positive. Each new bar is closed above previous. Signal – the first green bar after the intersection of the balance line from below up, Stop Loss – is slightly lower than a minimum of the bar before crosspoint.
A pattern «Breakdown of zero» on the histogram AO
- For sale: dynamics of the histogram changes from the positive to the negative. Each new bar is closed below previous. Signal – the first red bar after the intersection of the balance line from top to down, Stop Loss – is slightly higher than a maximum of the bar before crosspoint.
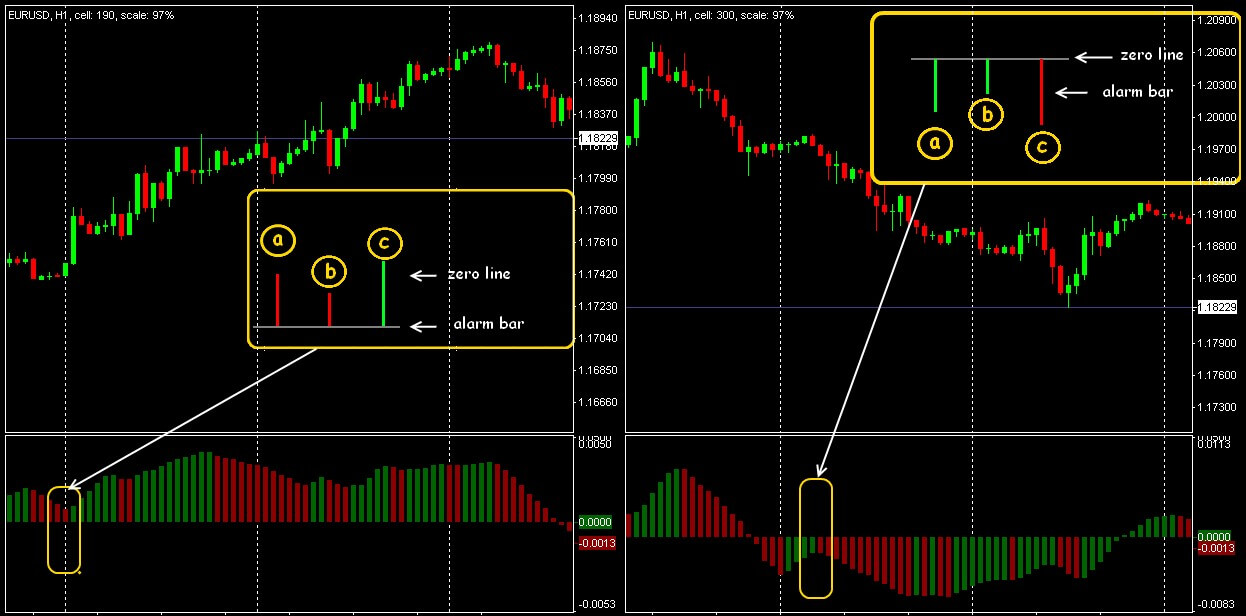
3. «Two peaks»
The model reminds a divergence – with its help we look for the first signs of a turn on the flat market sections: the weakening of the force of bears before purchase and bulls – before sale.
The signal shall appear earlier than there will be an intersection of zero level.
The histogram shall be above zero − for the search of a point of opening of the SELL transaction, and below zero − points of the opening of the BUY transaction.
Stop Loss – above/below the average bar of the model.
A pattern «Two peaks» on the histogram AO
The model is rather difficult to the identification, it can lead to false entrances, therefore, it demands confirmation from other tools.
If within the model the histogram crosses the zero line – the trade signal is canceled!
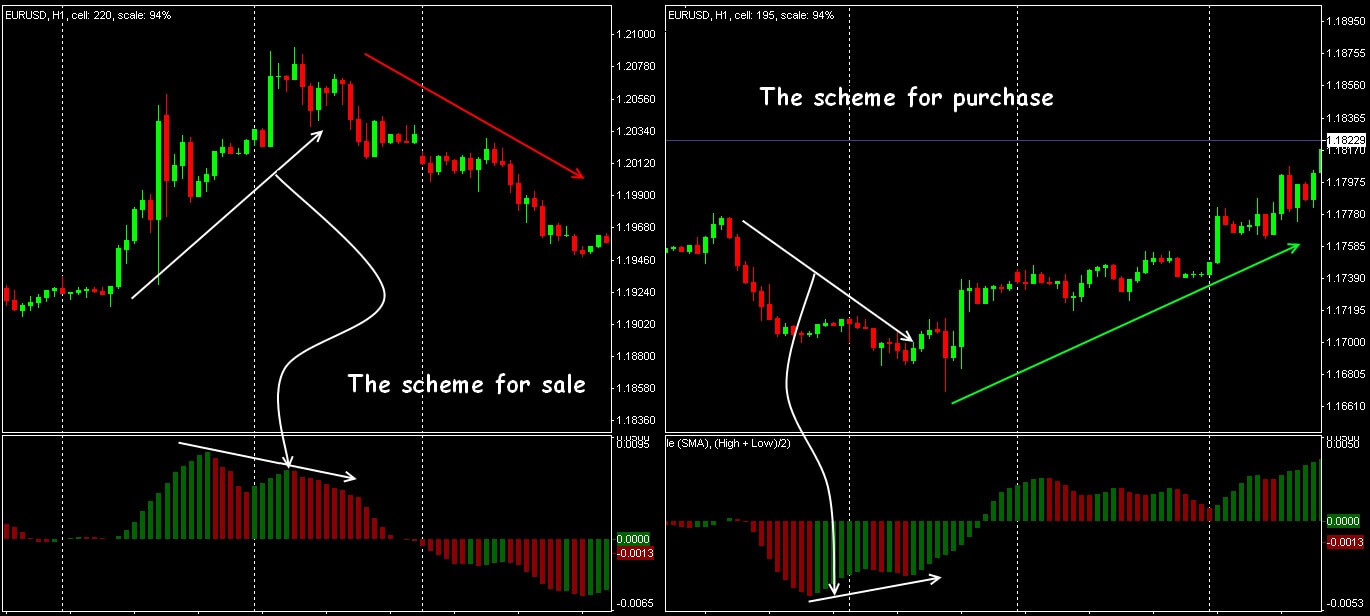
4. Divergence
The divergence of the line of the indicator with the price is traditionally considered strong signals: at bull divergence − we look for an entry point in SELL, at bear – an entry point in BUY.
Divergence on the histogram of Awesome Oscillator
Let’s get to backtesting Awesome Oscillator indicator
There are numerous signals the Awesome Oscillator can provide (the most used one are “Breakthrough of the zero level”, “Saucer”, “Divergence”, “Two peaks”), today we are going to test the trading strategy based at “Breakthrough of the zero level” signals.
The “Buy” signal appears when the histogram turns from negative meanings to positive.
To create the “Buy” signal:
- The first bar green bar must be under the zero level; second one must cross the zero level (conversion from negative meanings to positive);
- We enter the trade at the second bar after the intersection of the zero line;
- We exit the trade when the first red bar appears.
To create the “Sell” signal:
- The first bar red bar must be above the zero level; second one must cross the zero level (conversion from positive meanings to negative);
- We enter the trade at the second bar after the intersection of the zero line;
- We exit the trade when the first green bar appears.
We have tested the Awesome Oscillator indicator strategy (particularly the breakthrough of the zero level type) on Bullish, Bearish and Flat markets: on two periods of time each.
Reminder: We’ve tested the Awesome Oscillator strategy on 3 types of markets and 6 periods of time totally to get authentic results as much as possible. Check here what we take as the base of our backtesting experiment: 5-Step backtesting method.
Please, also note: we cannot guarantee the ideal performance of the strategy during the live trading even if it turned out to be profitable during the backtesting.
The backtesting gives you the statistically proven confidence in your trading decisions to some extent. However, we sincerely believe that without it trading becomes a synonym of the gambling or a lucky wild guess.
Please, keep in mind that you use the backtested strategy on a live trading account at your own risk.
| Market | Training Set | Forward Set |
|---|---|---|
| Bull | 01/03/2011 — 23/06/2011 | 09/06/2010 – 10/08/2010 |
| Bear | 01/01/15 — 27/03/2015 | 01/09/2014 — 27/10/2014 |
| Flat | 01/09/2016 – 08/02/2017 | 04/05/2015 – 12/06/2015 |
Technical information:
- Currency pair – EUR/USD
- Time frame — 1 hour
- Spread meaning – 5
- Stop Loss/Take Profit: we do not use in this strategy.
Backtesting Results
As you can see on the table below the Forward testing set helps us to understand the stability and utility of using the Awesome Oscillator.
Just take a look on the results in table below:
| Market | Training Set | Forward Set |
|---|---|---|
| Bull | +153 pips | -215 pips |
| Bear | +249 pips | +59 pips |
| Flat | +121 pips | +121 pips |
Application in trade Awesome Oscillator strategy
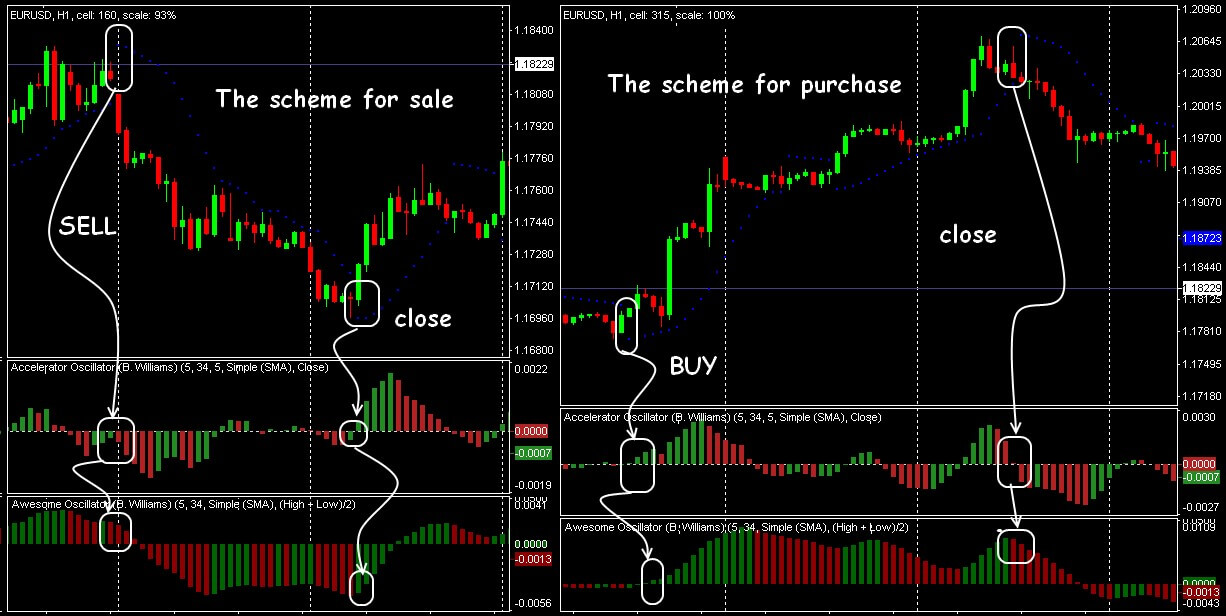
The author recommends using a linking of Awesome Oscillator+Accelerator Decelerator Oscillator: the AC indicator shows the trend speed, the AO indicator — its dynamics. (Using Indicators)
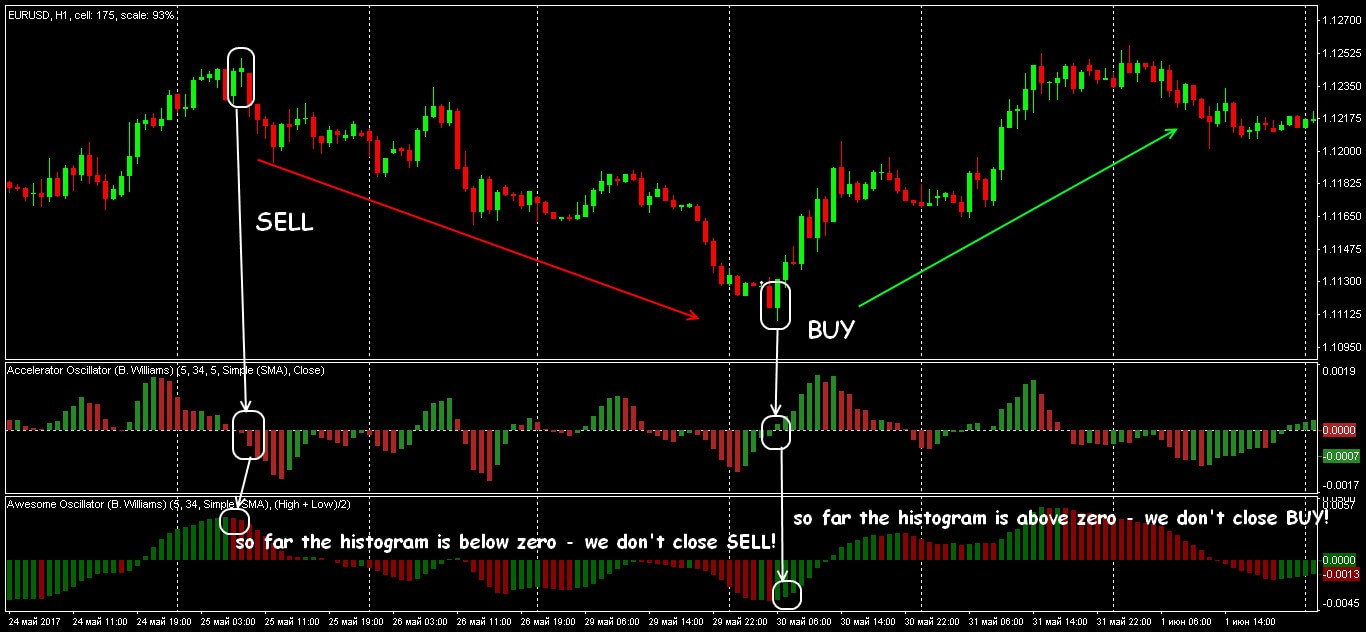
Example of trade signals of strategy of AC+AO
- For purchase: the color changes from red to green and two consecutive green bars appear on the AO histogram. If at the same time the AC histogram is green we open the transaction, we close — after the moment of change of color of both histograms to red.
- For sale – we argue similarly.
As the example of a complex system, the Parabolic SAR indicator can be added to this scheme – it will define a medium-term tendency of the market and will show levels for the optimum Stop Loss installation.
As the example of a complex system, the Parabolic SAR indicator can be added to this scheme – it will define a medium-term tendency of the market and will show levels for the optimum Stop Loss installation.
Example of trade signals of strategy of AC+AO+PSAR
- For purchase: the AO histogram punches zero level from below up; AC histogram is green; Paraboliс confirms the ascending trend (points are located under the price). We close the transaction after the emergence of a gap on the Parabolic line.
- For sale – the similar scheme.
The result?
Such strategy demands a strong trend (we look at Parabolic!), because it gives many false signals on the flat sites.
Several practical remarks
It all comes down to this:
Awesome Oscillator is most effective complete with other indicators of Williams.
The AO indicator badly reacts to market noise, but at the same time not bad compensates the speculative price throws dangerous to other oscillators.
The main advantage of the AO indicator can be considered lack of redrawing and universality – it has been developed for the stock and future market, but has perfectly proved also on currency assets.
Complexity in identifications of graphic models and delay of signals is especially noticeable during the periods below H1, therefore, Awesome Oscillator isn’t recommended to scalpers, but it has to be obligatory in an arsenal of medium-term traders.
Final words about Awesome Oscillator indicator
As you can see the Awesome Oscillator can be quite useful and can improve your way trading if you know how to use it properly of course.
Don’t forget that you can use the Awesome Oscillator strategy as you want it, with your data meanings, market type, periods of time, currency pair and etc.
In order to try the indicator performance alone or in the combination with other ones, you can use Forex Tester with the historical data that comes along with the program.
 Sign Up to FTO Waitlist
